v1.1.0 Connecting Scatter Plot Points with Lines
Overview
Scatter plots connect points with lines, enhancing trend visualization and performance.
In Starrydata Visualizer, we have added a new feature that connects data points in a scatter plot with lines. This enhancement makes it much easier to intuitively grasp the relationships and trends between samples.
Background
Previously, Starrydata Visualizer displayed data points on a scatter plot without any connecting lines, making it difficult to visually discern the relationships between samples. With this update, by connecting the points with lines, users can now immediately see changes and trends in the data.
Detailed Changes
1. Graph Display Changes
| Before: Scatter Plot with Points Only | After: Scatter Plot with Points Connected by Lines |
|---|---|
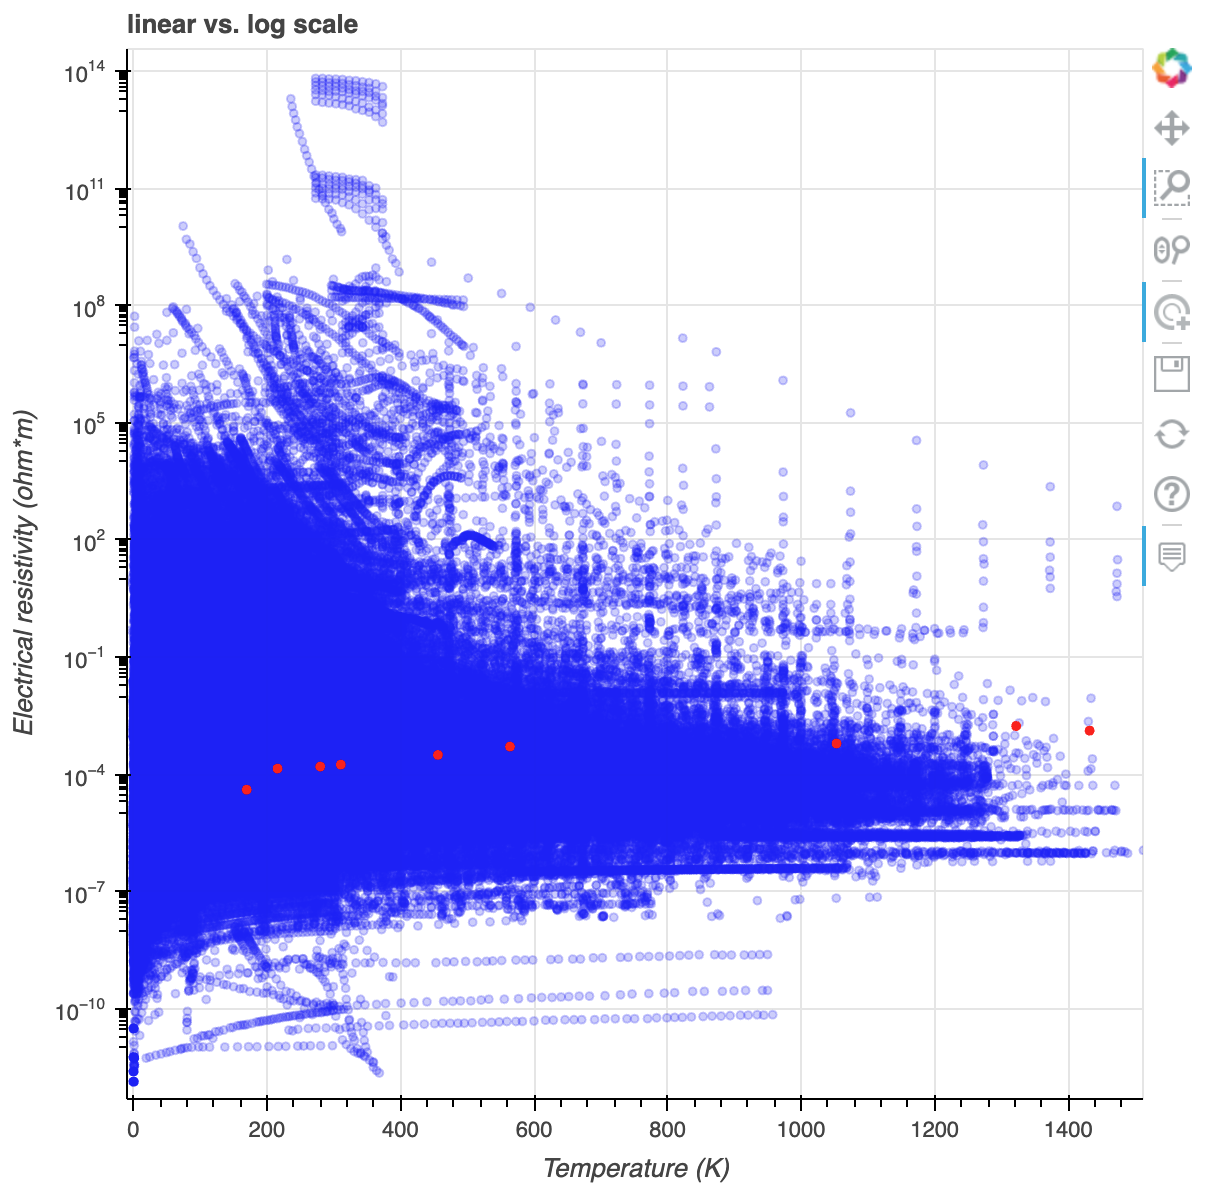 The previous version (v1.0.0) showed only the data points without any connecting lines, making it hard to recognize relationships between samples.
|
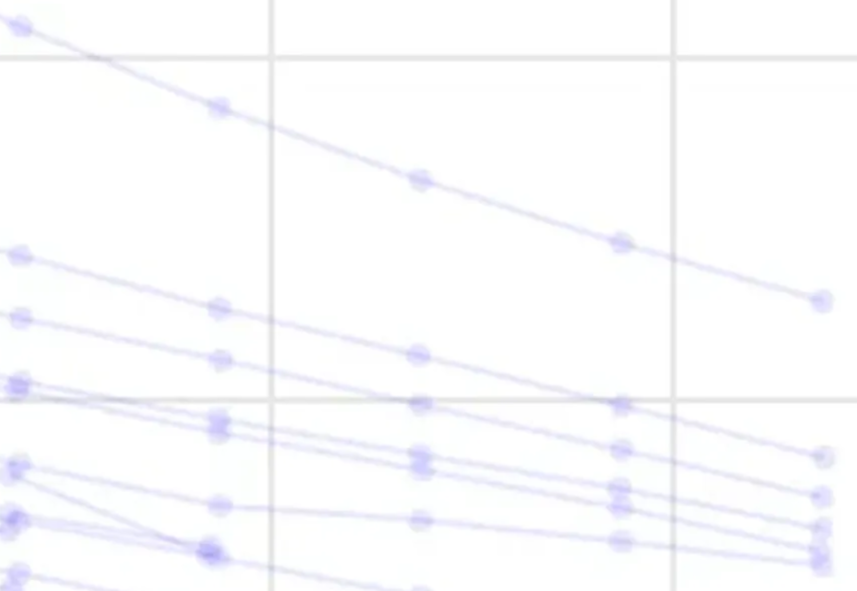
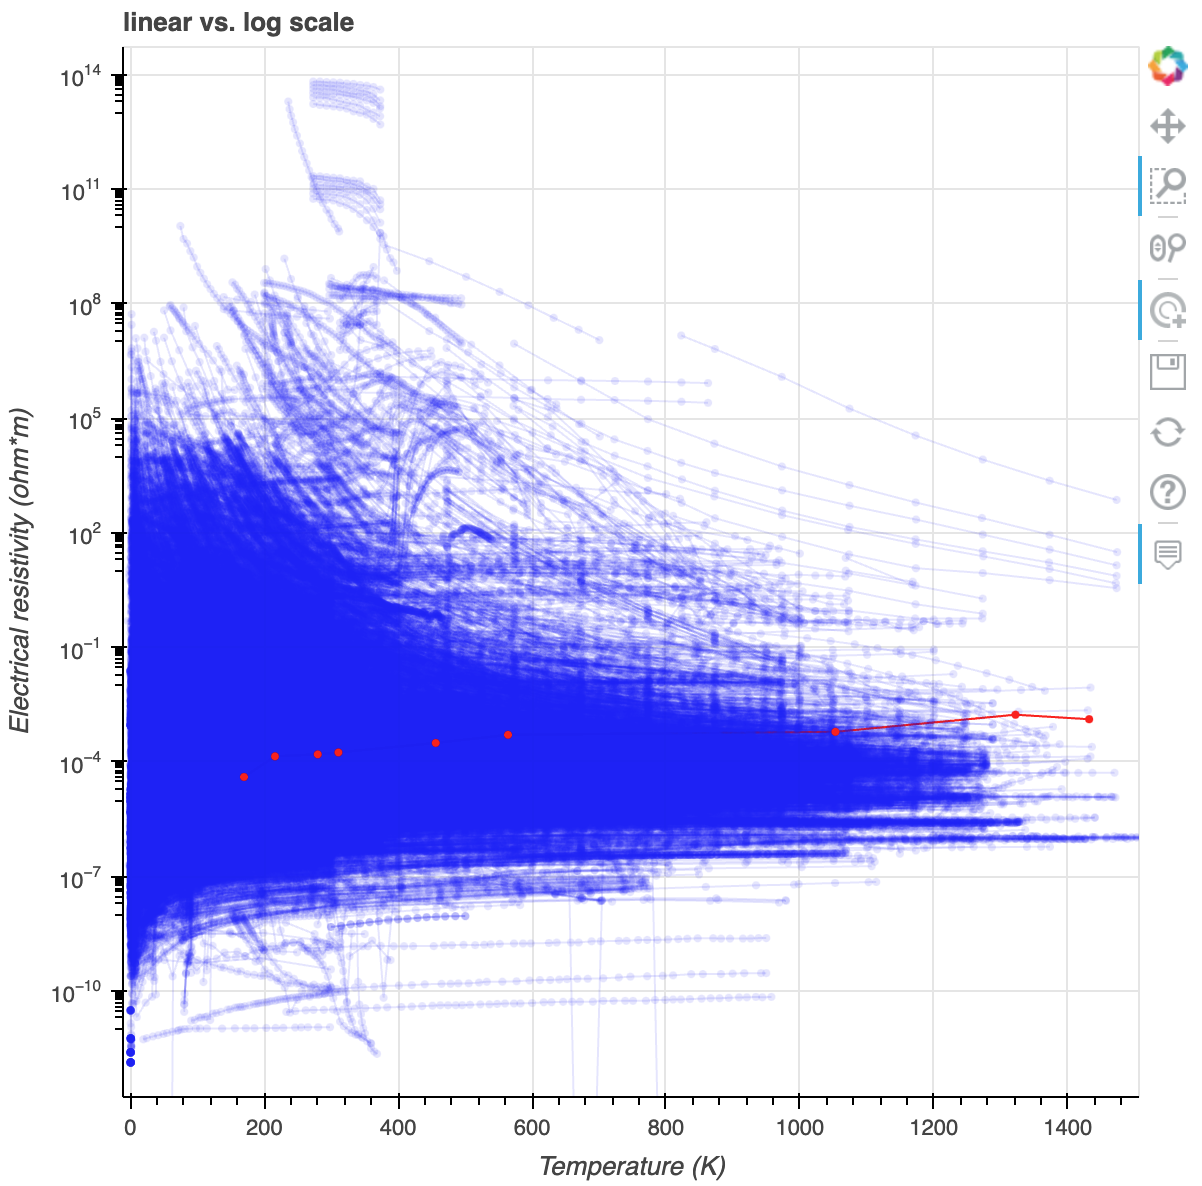 In the new version (v1.1.0), the samples are connected by lines, allowing trends and correlations to be seen at a glance.
|
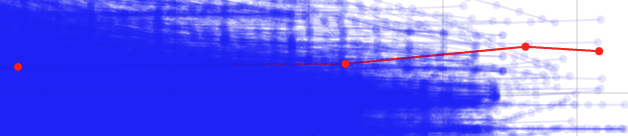
2. Important Notice
-
Drawing Order of Lines The lines are rendered behind the data points. Therefore, in graphs with a large number of points, some lines may be partially hidden.
3. Performance Improvements
Although adding line drawing increased processing demands, we optimized the performance to achieve significant speed improvements:
- Initial Rendering Speed Improvement
- Before: Average 14.93 seconds
- After (1.1.0): Average 8.56 seconds → The initial rendering process is approximately 1.7 times faster.
- Data Point Highlight Speed Improvement
- Before: Average 13.82 seconds
- After (1.1.0): Average 4.77 seconds → The data point highlighting process is approximately 2.9 times faster.
| Operation | Version | Test 1 (s) | Test 2 (s) | Test 3 (s) | Average (s) |
|---|---|---|---|---|---|
| Initial Rendering | Before | 14.8 | 14.7 | 15.3 | 14.93 |
| Initial Rendering | After (1.1.0) | 8.49 | 8.69 | 8.49 | 8.56 |
| Data Point Highlight | Before | 13.96 | 14.06 | 13.45 | 13.82 |
| Data Point Highlight | After (1.1.0) | 4.91 | 4.62 | 4.77 | 4.77 |
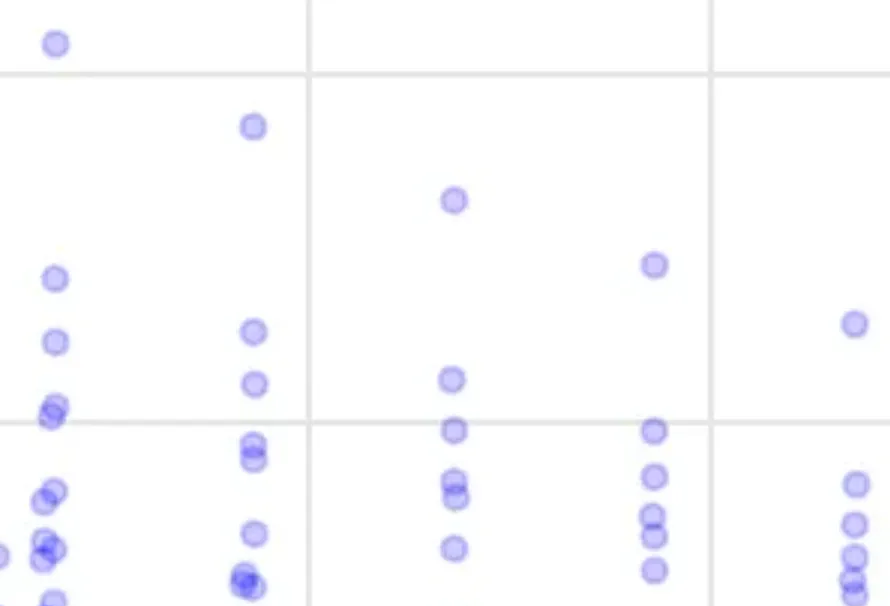
4. Design Changes for Enhanced Speed
In addition to the performance optimizations above, we changed the design of the data point rendering. Previously, data points were drawn with a border; removing the border has reduced the average processing time by more than half.
| Before (with border) | After (without border) |
|---|---|
|
|
Summary
This update achieves the following:
- Improved Data Visualization: By connecting scatter plot points with lines, it is now easier to see trends and relationships.
- Significant Speed Enhancements:
- Initial rendering is approximately 1.7 times faster.
- Data point highlighting is approximately 2.9 times faster.
- Optimized Design: Redesigning the data point rendering has further optimized performance.
For a deeper dive into the performance improvements, please check out this detailed blog post.
Code contributors: Tomoya Mato